On July 31, 2025, the Centers for Medicare & Medicaid Services (CMS) issued the Inpatient Prospective Payment System (IPPS) Final Rule,[1] which marked an unprecedented step in the codification of value-based care reimbursement to hospitals through implementation of the Transforming Episode Accountability Model (TEAM). TEAM is the first mandatory bundled payment model exposing hospitals to 2-sided risk through shared savings or losses based on all costs associated with a surgical episode from the initial procedure through 30-days post-discharge.[2] TEAM is also agnostic to site of service, applying to both inpatient and ambulatory settings.
TEAM forces selected hospitals to become risk-bearing entities responsible for the full risk of savings or losses for all Medicare Part A and B services associated with five designated care episodes. InHealth developed a free TEAM Dashboard tool to help hospitals navigate the financial and operational challenges posed by TEAM.
Below is a summary of the key takeaways from this article:
TEAM’s episode-based payment system is scheduled to run from January 1, 2026 to December 31, 2030. Hospitals located in selected Metropolitan Statistical Areas (MSAs) are automatically enrolled (“mandatory participants”), while all other acute care hospitals may opt in during an application window. As of August 2025, there were 734 mandatory participants and 10 voluntary participants in TEAM. TEAM episodes begin with one of five anchor procedure categories—coronary artery bypass graft (CABG), lower extremity joint replacement (LEJR), major bowel procedure, surgical hip/femur fracture treatment (SHFFT), or spinal fusion—and include virtually all Part A and Part B spending for 30 days post discharge. Under TEAM, a hospital receives the episodic payment and is responsible for distribution amongst all care contributors.
CMS establishes a target price for every episode, then applies a 1.5 to 2.0 percent decrease to the target price to build expected savings into the model. The target price is risk-adjusted based on factors such as patient clinical/social risk and age, as well as hospital bed size and safety net status. An annual reconciliation will compare actual episode spending with the target price, which is regionally-adjusted based on other facilities in the same Census Bureau Statistical Area. In Track 1 (performance year 1 only), hospitals may earn a shared savings payment of up to 10% of total spending; for Track 2 shared savings are capped at 5% of total spending. For Track 3 (to which all hospitals are assigned in 2027, unless they meet an exception), shared savings range up to 20% of total spending, while shared losses are capped at 20%.
Finally, shared losses and savings are subject to adjustment based on performance related to quality measures tied to readmission rates, adverse events, patient reported outcome measures (PROMs), and mortality rates. The higher the performance on the quality measures, the greater the potential shared savings or diminishment of shared losses. The table below summarizes the maximum potential shared savings bonus or shared loss decrease should a hospital achieve top quality scores:
Based on preliminary analyses, up to two thirds of hospitals are expected to generate losses on TEAM episodes.[3] This assessment is reflected in CMS’s actuarial analysis, which projects that TEAM will save Medicare approximately $368 million over the five performance years.[4] Given the potential financial impact of TEAM, hospitals that plan to succeed in TEAM must proactively understand the areas of savingsopportunity in the five episodes.
What’s included. TEAM aggregates nearly all Medicare Part A and B services tied to the episode from the anchor hospitalization/outpatient procedure through 30 days post-discharge (with defined exclusions).[5] These costs include physician services, inpatient/outpatient hospital services, post-acute care (PAC) services (e.g., inpatient rehabilitation facility (IRF), skilled nursing facility (SNF), home health agency (HHA), and outpatient therapy (PT)), Part B drugs and biologicals, and durable medical equipment.
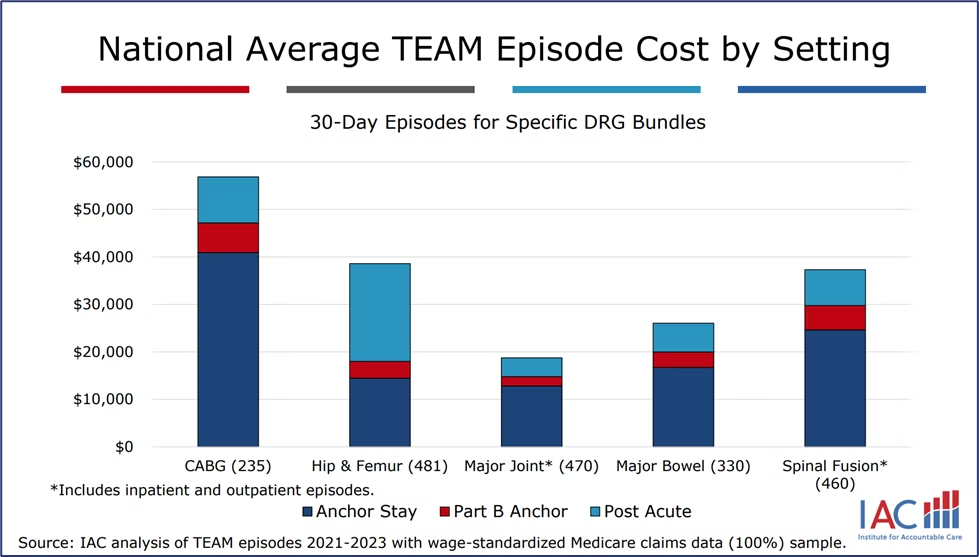
Cost Components of the Episode. Costs typically accrue across the following major categories: (1) the inpatient facility stay or outpatient procedure, (2) physician professional fees, (3) PAC (IRF/SNF/HHA/PT), and (4) readmissions and emergency department use. The image produced by the Institute for Accountable Care[6] shown below summarizes the distribution of costs by episode component:
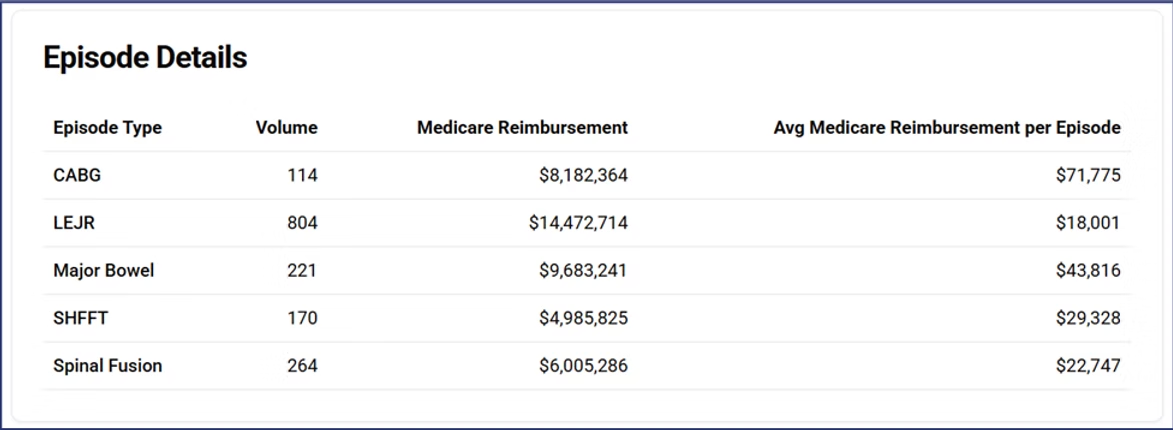
InHealth’s TEAM Dashboard provides healthcare leaders a convenient resource to evaluate the potential impact of TEAM based on historical Medicare claims. You can search by facility or marketplace to identify TEAM financial and operational metrics. For example, the TEAM Dashboard provides insight into historical Part A utilization and spending on the TEAM episodes for a particular facility or market, as shown in the screenshot below:
Furthermore, InHealth’s TEAM Dashboard provides insight into the potential for shared savings and losses associated with Part A spending by participation track, as shown below:
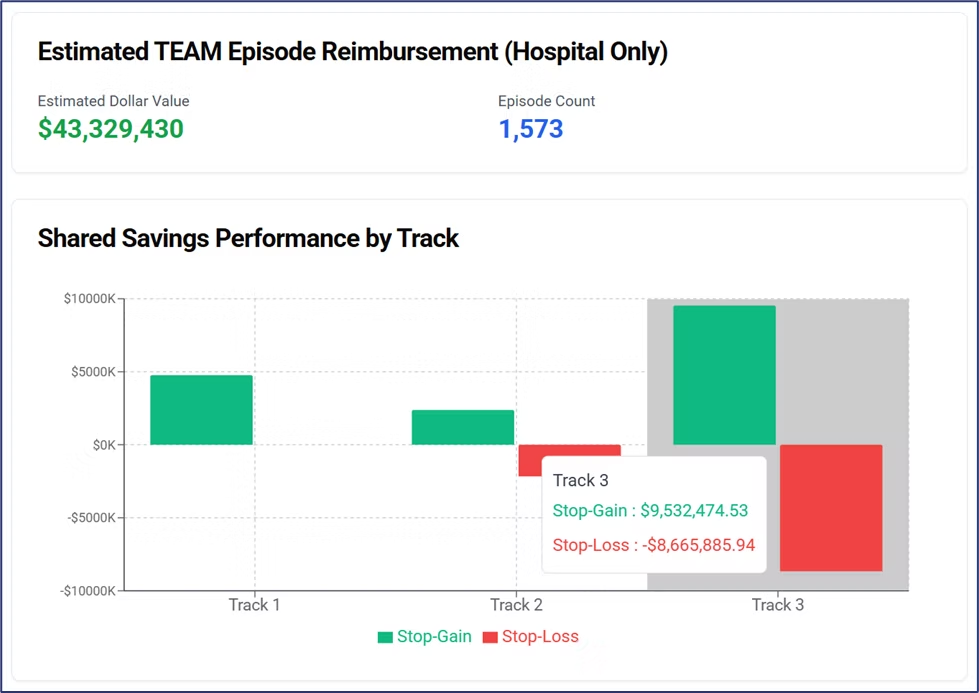
For example, in the image above, we estimated Medicare facility reimbursement of over $43 million associated with the TEAM episodes, which implies potential Track 3 shared savings of up to $9.5 million (assuming top performance in the Composite Quality Score) or losses of up to $8.7 million (assuming poor performance in the Composite Quality Score).
Based on the design of the TEAM episodes, hospitals must identify high-value partners to ensure alignment with the dual goals of cost-effectiveness and high-quality care. The list below identifies the key provider groups with whom hospitals must ensure a joint commitment to high value care.
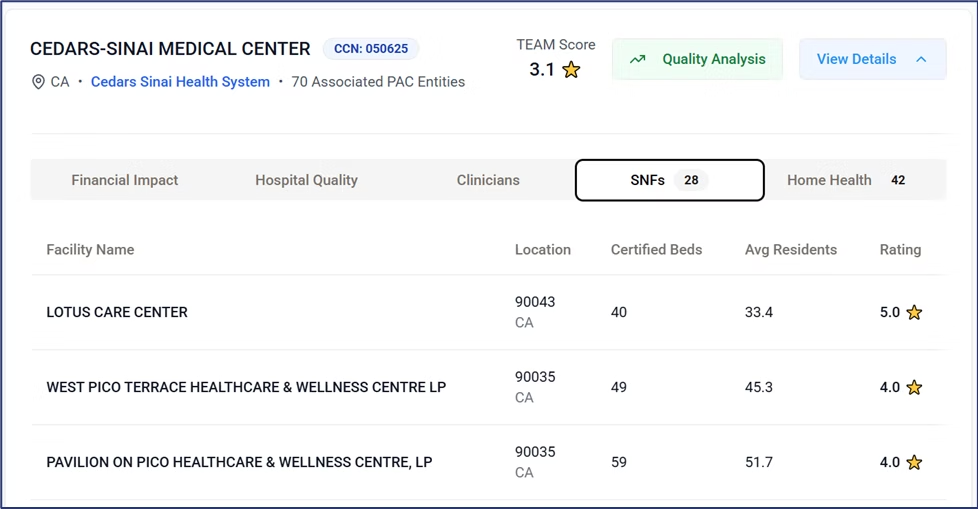
Oftentimes, the key partners identified above are owned and operated independently from the hospital. Accordingly, formalized contractual partnerships may be needed to distribute funds and drive success in TEAM. To help hospitals understand the landscape of partner organizations, the TEAM Dashboard enables a listing of key PAC providers located within a hospital’s service area, while reporting on the historical performance on CMS quality measures of those providers. For example, the image below presents the high-performing SNFs located in the service area of Cedars-Sinai Medical Center.
Given the magnitude of potential savings and losses, hospitals must develop a concentrated focus on managing costs and delivering high quality care. This can be a daunting task, given the scope of services
Given the magnitude of potential savings and losses, hospitals must develop a concentrated focus on managing costs and delivering high quality care. This can be a daunting task, given the scope of services associated with each episode. Fortunately, an ample body of literature and prior provider experience help inform initial areas of opportunity.
Low Value Care. Evidence from the CMS bundled payment models, such as Bundled Payments for Care Improvement - Advanced (BPCI-A) and Comprehensive Care for Joint Replacement (CJR), consistently shows that reductions in post-acute utilization‑ drive most savings—an important signal for TEAM participants, even with a shorter 30 day‑ episodic window.[7] Wider research from Medicare innovation models has identified additional drivers of excess spending. These include surgical device selection and vendor variation in implant, biologics and other supply costs. Furthermore, fragmented patient transitions (e.g., from surgeon team to PAC provider) have been observed to inflate spending and complicate recovery.[8]
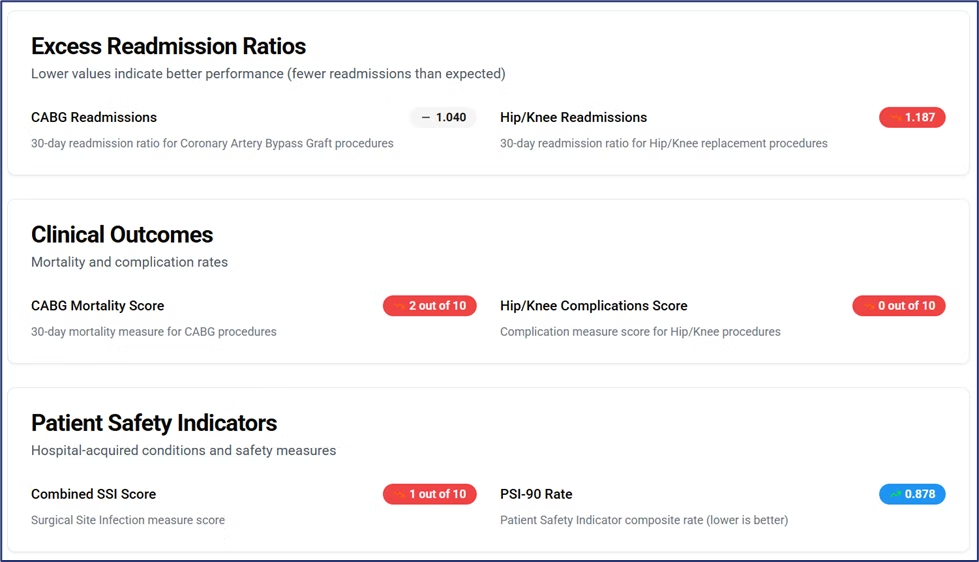
To help specific hospitals identify where to begin identifying low-value care, the TEAM Dashboard highlights the quality performance of hospitals using measures that will be pertinent to TEAM quality scoring. The screenshot below shows a snapshot of the hospital quality measures, indicating that the facility below has room for improvement in knee/hip readmissions and complications, CABG mortality, and surgical site infections.
Value-Added Activities. Given the observations of low-value care above, healthcare organizations have adopted effective strategies to mitigate excess spending. The table below summarizes a few examples:
For research supporting the above strategies, refer to the linked resources published by the American Society of Anesthesiologists, JAMA Health Forum, and NYU Langone Health.
TEAM-Specific Considerations. In addition to the tactics above, TEAM hospitals must develop capabilities within the following quality domains:
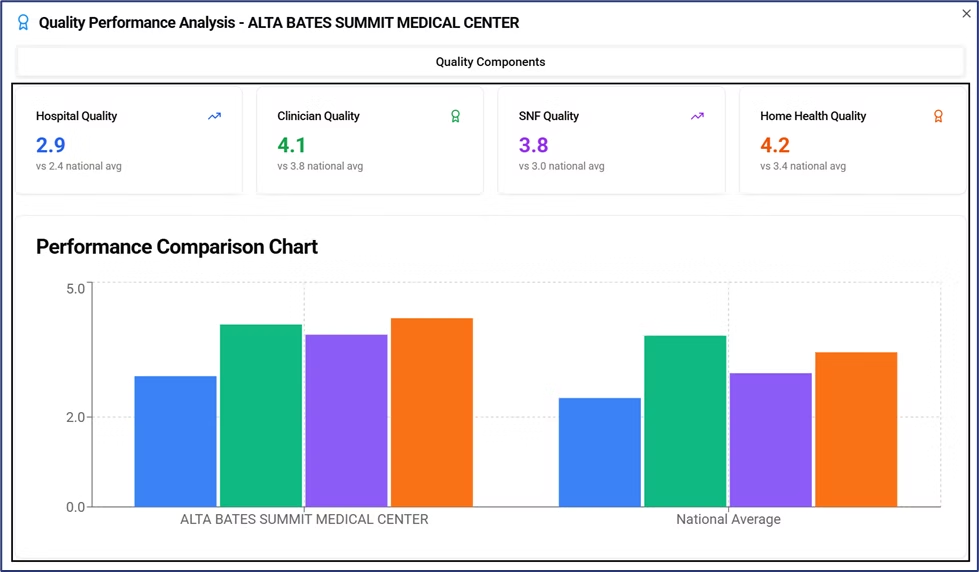
To understand the comprehensive historical quality performance of TEAM hospitals and the clinicians, SNFs, and HHAs located in their service areas, the TEAM Dashboard provides an easy-to-use comparison to national averages. The screenshot below presents the overall quality scores for a high-performing hospital in comparison to national averages:
While CMS expressly permits TEAM hospitals to use gainsharing arrangements and downstream distribution arrangements, Stark Law[9] and Anti-Kickback Statute (AKS)[10] constraints still apply. Often, these constraints can hamper the ability of hospitals to appropriately incentivize their independent partners and employed physicians to advance value-based care goals. Fortunately, both CMS and the Office of Inspector General (OIG) finalized new Stark Law exceptions and AKS safe harbors in 2021 that provide unprecedented flexibility to organizations involved in value-based care. These flexibilities were codified in the Value-Based Enterprise (VBE) framework.
This list below summarizes new flexibilities available to participants in a VBE:
In the past, each of these activities could have been significant compliance violations or risks to organizations. Through meeting the requirements[11] of the VBE exceptions and safe harbors, hospitals can avail themselves of a compliant pathway for implementing the above strategies. In light of these flexibilities, the table below summarizes VBE use cases that InHealth has helped clients develop to address TEAM-related challenges.
The lift required to develop a VBE is not different from the time and costs associated with traditional arrangements, especially when factoring in the resources required to negotiate contracts and obtain third-party fair market value opinions.
Based on the information in this article, hospital leaders can take the following steps to establish readiness for TEAM:

Lorem ipsum dolor sit amet, consectetur adipiscing elit. Suspendisse varius enim in eros elementum tristique. Duis cursus, mi quis viverra ornare, eros dolor interdum nulla, ut commodo diam libero vitae erat. Aenean faucibus nibh et justo cursus id rutrum lorem imperdiet. Nunc ut sem vitae risus tristique posuere.
Share this entry: